In our previous blog post covering our in-house Security Orchestration, Automation & Response (SOAR) application, we described the data model for the system and basic features allowing security analysts to review events and trends across Appian’s many security monitoring systems.

In this one, we will discuss Orchestration within SOAR by looking at our integrations with alert and threat intelligence providers, and cover the lightweight case management system that markedly increases auditability and visibility by centralizing analysts’ investigation notes and event status in one place. These notes and status changes are then streamed to our security systems in real time through APIs to make analyst notes available to external teams responsible for administering some of our IT environments. Before accounting for automation, orchestration alone has saved the Appian Security Operations team hundreds of hours, and probably helped Appian IT save a few dollars on replacement mice by dramatically reducing mouse clicks. Read more to find out how.
Alert management
The first step in managing security alerts is obviously getting the alerts. At Appian, we use a diverse stack of commercial security products, cloud services, open source tools, and custom security solutions to monitor our IT environments and ensure the security of both our internal data as well as that of our customers. The vast majority of these tools provide an API that can be used by the SOAR application to retrieve alerts. Because we modularized data storage and enrichment workflows into their own reusable process models, integrating a new alert source is very easy. All that is required is configuring the API call using an Integration object, parsing the incoming data, whether JSON, XML or any other format, into the SOAR data schemas, and passing it to the reusable components to handle the rest.
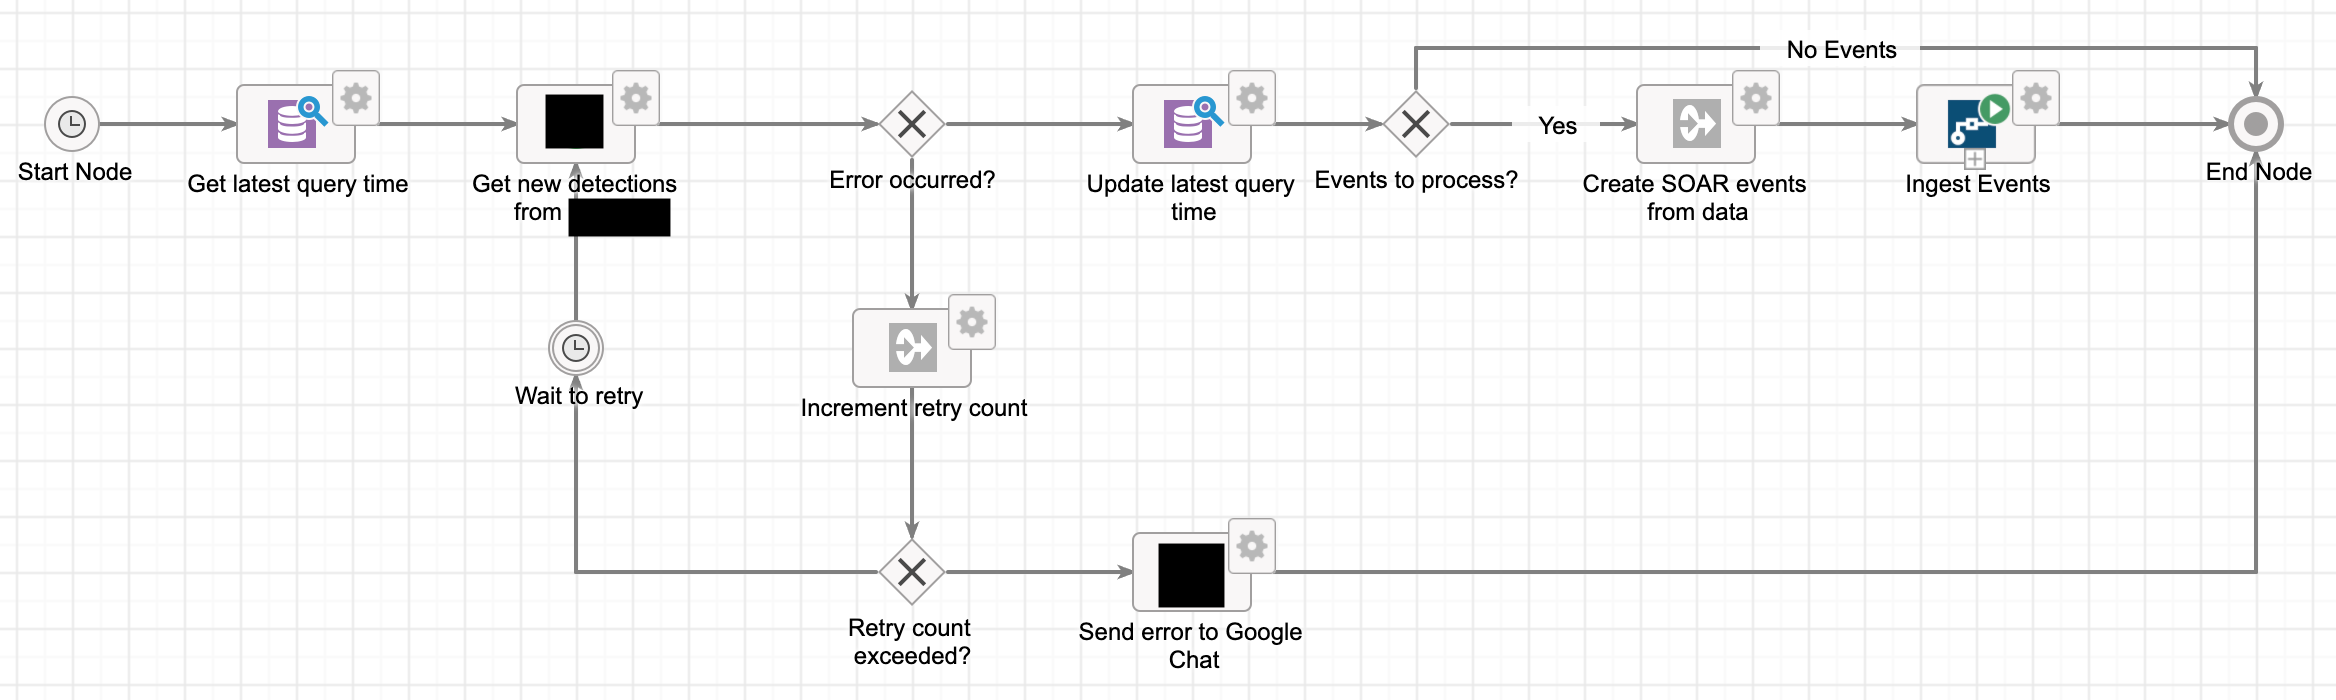
Having such an easy way to integrate new alert sources with the application enables us to onboard a new security tool into the system in a few hours. Beyond speed, one of the many benefits of using Appian for data ingestion in complex multi-system environments such as an entire security monitoring stack is its flexibility. Appian can support an almost limitless variety of data sources, including internal ones, without requiring costly data migrations or custom code. For alert sources that do not have APIs, we can just as easily ingest alerts sent to Appian via email, through Appian Web APIs or even use Robotic Process Automation (RPA) to scrape alerts from a source. In addition to alerts originating from tools, we’ve even used Appian to build our own detection logic to generate alerts by analyzing raw data fetched from APIs.
Improving analyst efficiency with automated threat intelligence
Security alerts almost always contain information, such as IP addresses or domains, that are fairly meaningless without additional context. In order to make sense of these, a frequent first step for a Security Operations Center (SOC) analyst is to visit their favorite threat intelligence sources to gather this context. Looking up data from different internal and external tools is time consuming and requires a lot of swivel chairing between tools. For example, a 2019 survey by Managed Security Services Provider Critical Start found that 78% of surveyed analysts spent over 10 minutes investigating each alert. Even if an analyst did nothing but tirelessly triage alerts without ever having lunch or coffee, this means the typical analyst can only address at most 48 alerts in an 8-hour workday. A typical SOC, including ours, will receive hundreds or thousands per day, so we needed a solution that could support addressing more while allowing for coffee, lunch, and projects that proactively contribute to our security posture.
To reclaim their coffee breaks and reduce the time burden of conducting lookups across multiple sources, some security analysts build elaborate scripts that return vast amounts of data to be further manipulated on the command line. Instead of doing this manually, we automate queries against several threat intelligence sources favored by our analysts, automatically classify each threat intelligence source’s verdict of the indicator based on its response, and finally render the data nicely along with an aggregate classification of the indicator as a whole based on the data and decision rules. To supplement indicator enrichment, we add automated enrichment to the events themselves with relevant event-specific history, such as retrieving DNS activity from an associated host around the time of an alert. As a result, analysts can now get a comprehensive picture of the nature of an event and its indicators in seconds, with in-depth data available without ever taking their eyes off the alert or even opening a new tab. For example, using just the following screenshot, an analyst can review all of the information from GreyNoise and determine that the IP in question is a malicious, but known, internet scanner.
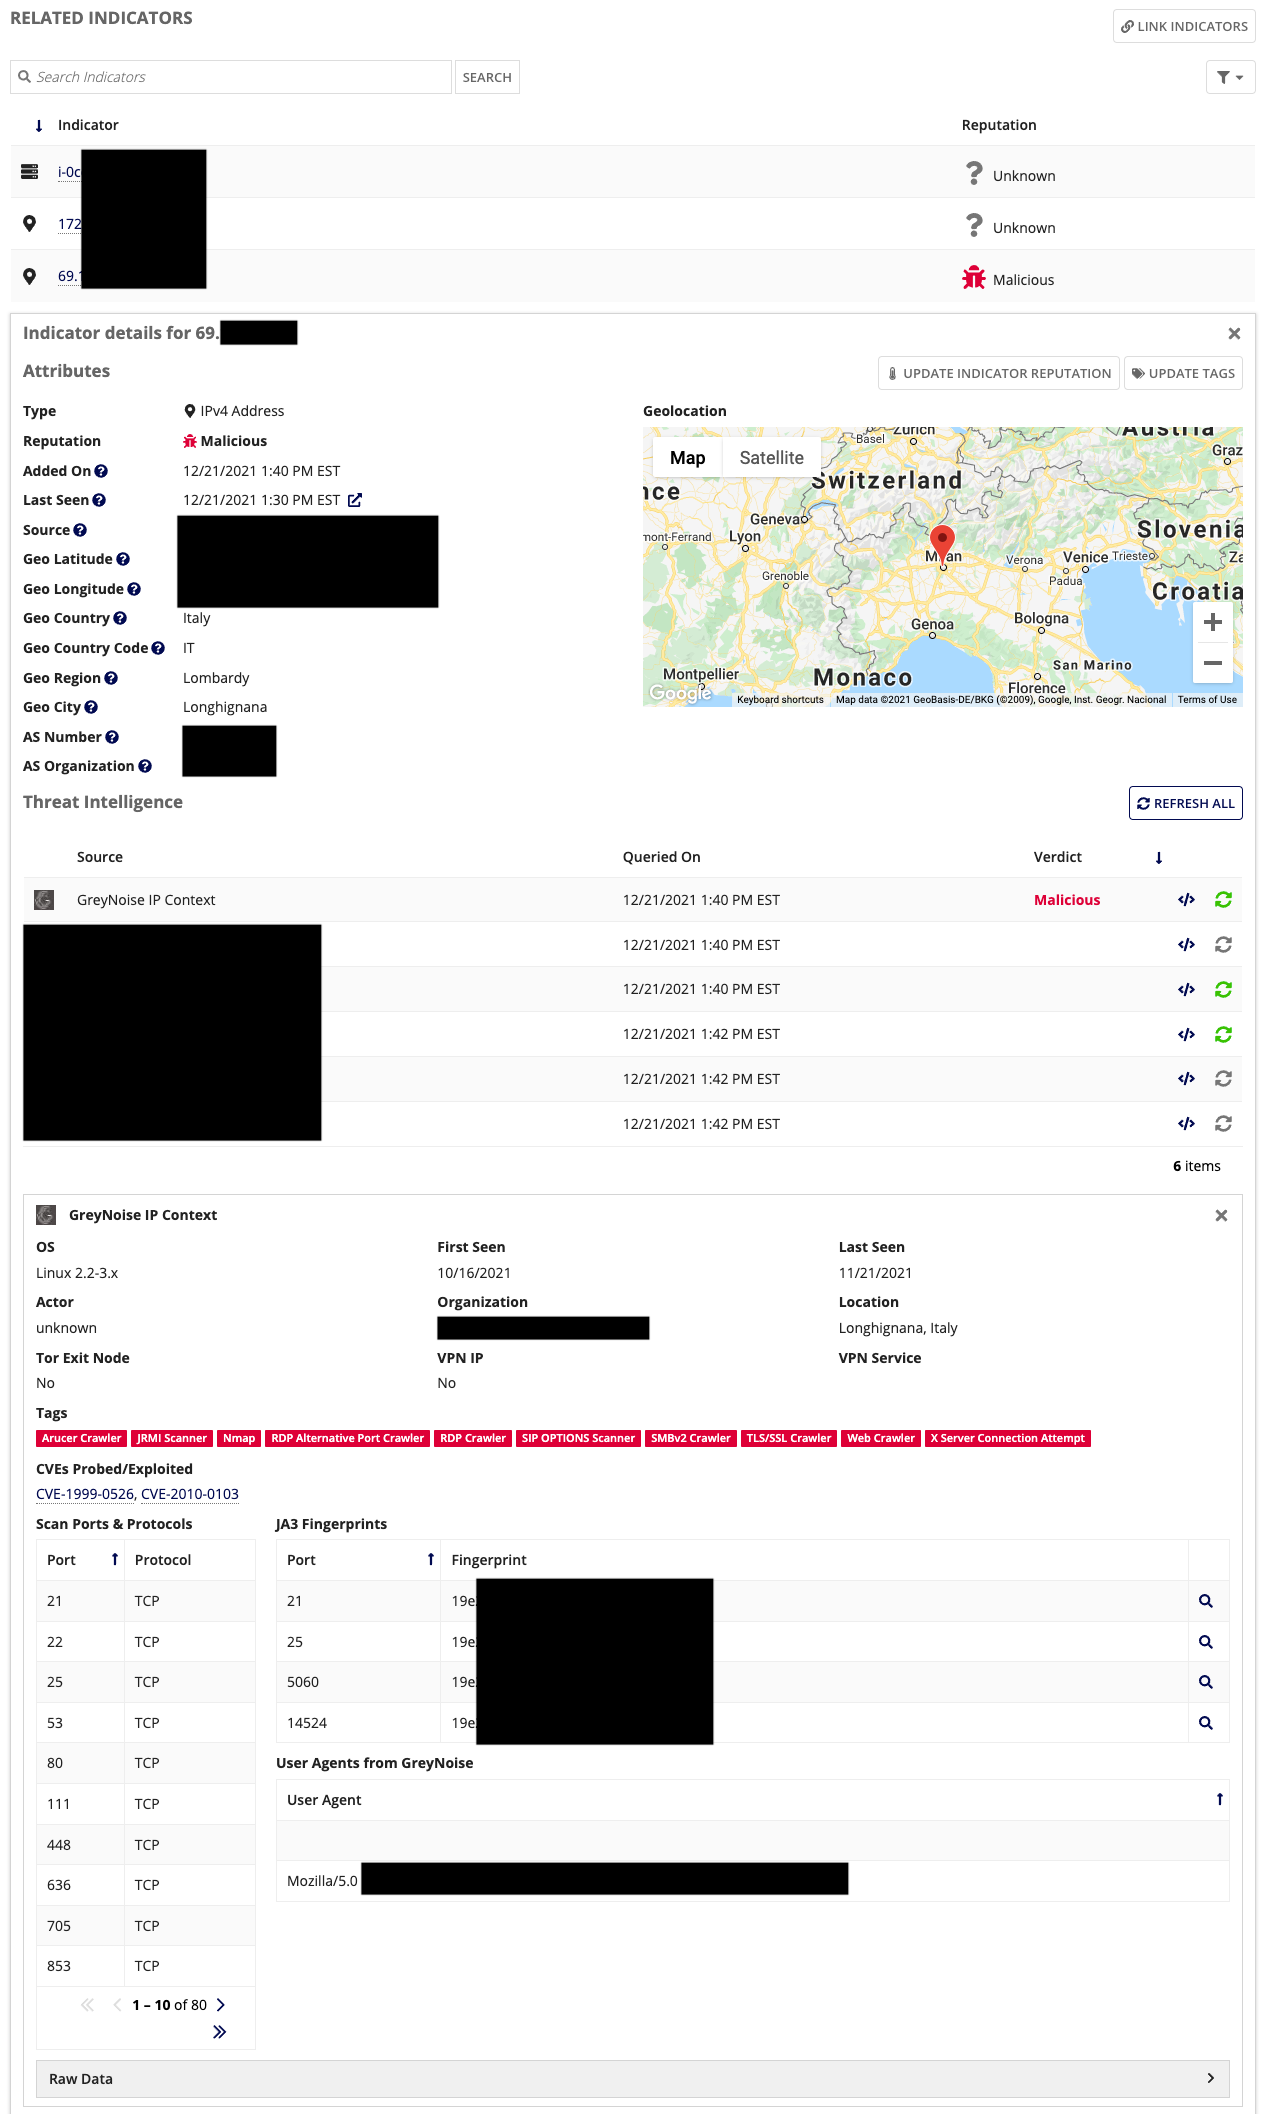
On the development side, we made adding new threat intelligence sources just as easy as adding event providers, and built a configurable caching layer using the application’s database to conserve API credits while still ensuring the data remains up to date. Thanks to these features, we can accommodate analyst requests for new data sources quickly, keep API usage budgets in check, and ensure our analysts are happy with their tools.
Investigate once, review often
Anyone who has spent any meaningful time in a SOC can attest that a SOC analyst’s life is filled with repeated events. Even though machine learning and artificial intelligence have helped some security systems avoid repeated false positives by establishing baselines and focusing on anomaly detection over rigid rules-based alerting, most organizations still use many tools reliant on the old paradigm. Rules-based alerting means every known vulnerability scan from a customer against their instance or execution of a file hash that is falsely classified as malicious will trigger a new alert, no matter how often it has been cleared from the queue. Without a good system of record for prior work, analysts will inevitably re-review and repeat the work done to establish an alert as a false positive, benign activity, or just otherwise not relevant.
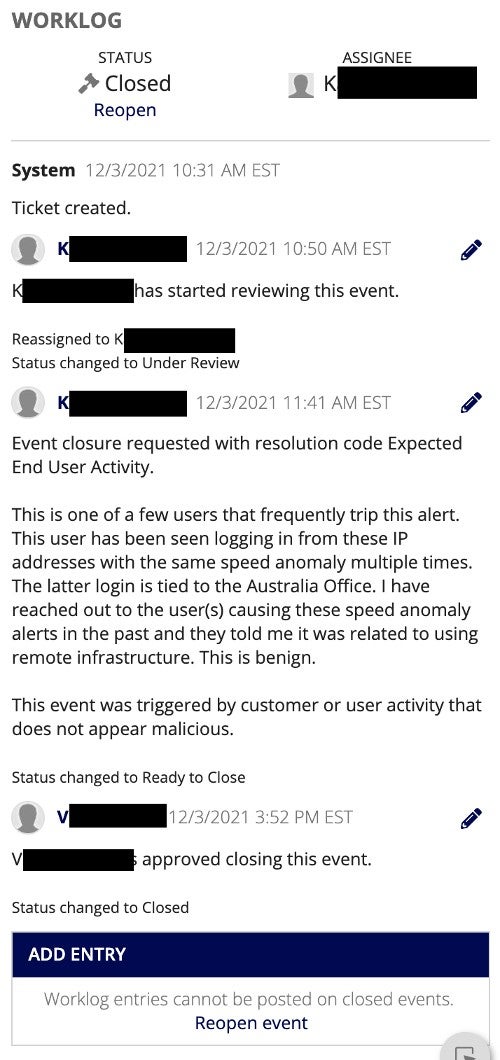
We initially started by building the case management module, called the Worklog, around events. This was a logical place to start collecting data, and in addition to recording event status, assignee, and analyst notes, it provides security operations management with auditability of event review SLA performance and automated notifications of any events that are nearing the end of their SLA period. We also added a feature for collecting resolution codes to events for tracking what percentage of events required action, and the reasons behind events that did not. The final part of this module became the “Ready to Close” status, which would prompt senior analysts to review events closed by more junior personnel before they would fully disappear from the queue as closed. By adding all of these features on top of events, we have vastly improved the auditability and shareability of the work our analysts perform every day. For example, these features helped us find out that our security operations team met the SLA for 100% of events during all of 2021!
To enable the rest of the company to benefit from the Worklog, we leveraged Appian’s integrations to connect the event worklog with the source systems for the alerts, automatically streaming analyst entries into the SOAR application back to their originating systems so that the alert statuses remain in sync and analyst work can be reviewed by IT and Appian Cloud administrators where required.
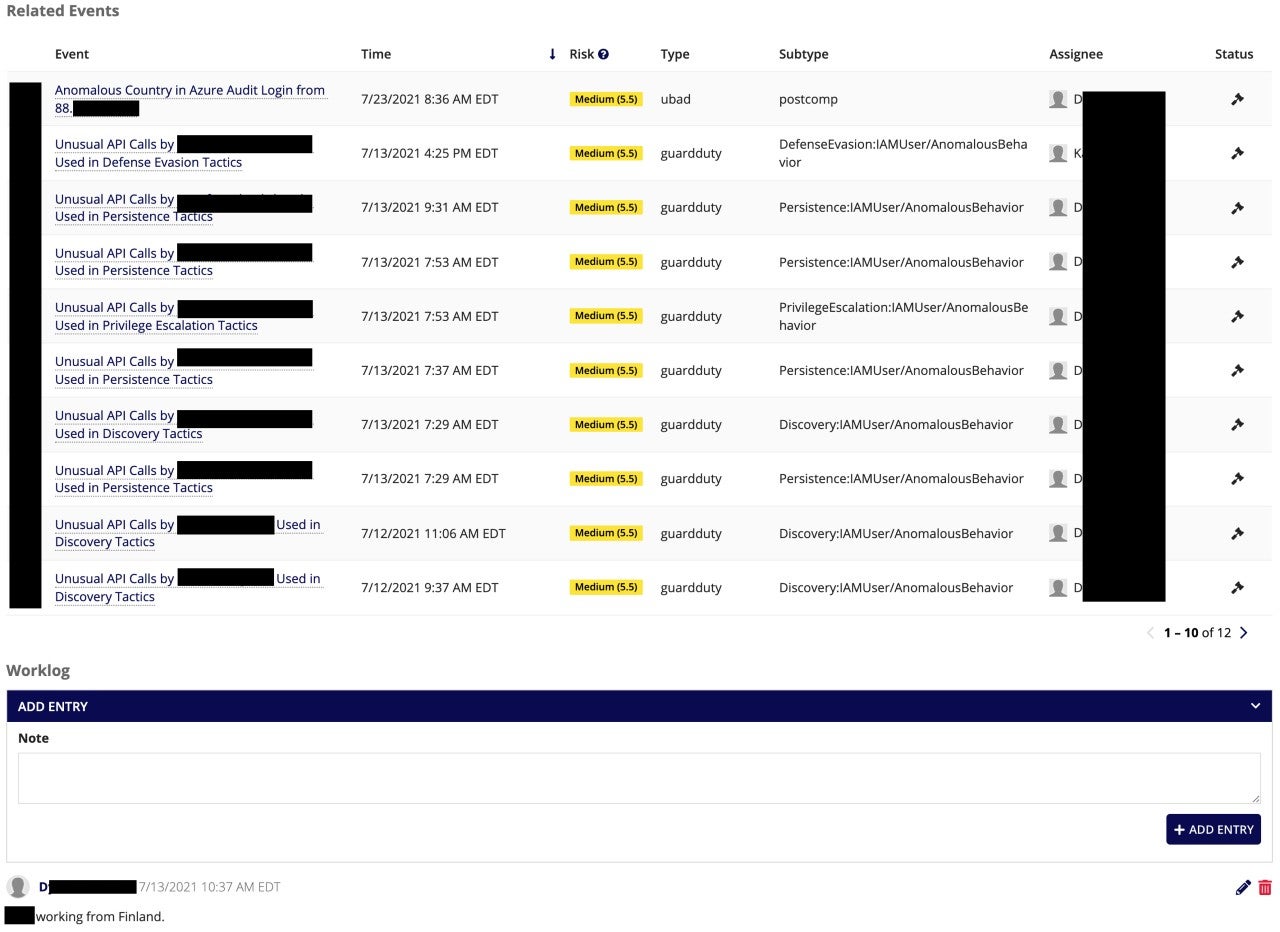
Adding case management to just events has one major shortcoming when it comes to helping analysts do their job more efficiently. When something unusual happens, there will often be a pattern of multiple somewhat related but different events. For instance, a developer logging in from a trip abroad might trigger alerts from an identity/SSO provider, VPN gateway, AWS GuardDuty, and more. In a similar vein, if a malicious actor compromises an endpoint, it might show an alert from its antivirus system and simultaneously have unusual Windows event logs. With multiple analysts reviewing events, it can be hard to tell that the events are related, and identifying related events of different types programmatically may be unreliable and is certainly difficult. However, one thing these events have in common is the fact that they share a target or an indicator of compromise. To leverage this commonality and help analysts consolidate research across multiple events, we expanded the Worklog to cover indicators and built a feature to automatically fetch all events that a particular indicator appears in. With these enhancements, in addition to being able to review up-to-date threat intelligence, the indicator records allow analysts to quickly view the history of an indicator within Appian’s environment and record notes for future reference. This helps drastically reduce the amount of repeated research work as well as manual searching that is necessary to truly understand whether an alert is worth being concerned about and enables analysts to spend the majority of their time investigating novel events as well as proactively threat hunting for anomalous activity in raw data.
Improving manual work by reducing friction
Introducing automated threat intelligence gathering, case management, and historical context to the SOAR application added a few notable wins to our list from the previous blog post:
- Significantly improved analysts’ efficiency by making context readily available and eliminating the need to access additional systems to understand incoming alerts
- Improved analyst quality of life by centralizing investigation notes, thus reducing the need to re-triage repeated alerts and shifting time toward threat hunting and investigating novel events
- Allowed senior analysts to review junior analyst performance on individual events and department leaders to audit and report on performance against alert review SLAs
- Improved awareness between departments by streaming updates from SOAR to external systems where applicable
Having made manual analyst work much more palatable, we were ready to proceed to getting rid of some of it altogether by introducing Automation to our application. In our next blog post, we will cover the steps we took to introduce configurable no-code automation to help us cut out the noise and multiply our time savings
If building or using tools like SOAR sounds interesting to you, be sure to check out our open positions! We are currently looking for an Information Security Application Engineer to work on SOAR and many other security-focused Appian projects, as well as students looking to launch a career in InfoSec as an Information Security Analyst.