In today's disruptive environment, bottlenecks in business processes cost organizations too much. Process models like spaghetti diagrams help leaders see how to optimize and boost efficiency. By providing a visual representation of processes, these models help organizational leaders to gain process transparency, identify areas for improvement, optimize workflows, reduce waste, and increase productivity.
Learn what spaghetti diagrams are, see examples, and discover how they’re used and how they relate to process mining and process automation.
[ Get started on your process discovery journey. Read the Process Mining Guide for tips and best practices. ]
What is a spaghetti diagram?
A spaghetti diagram, or spaghetti chart, is a visual representation of how people, products, or data move through a process. It’s a type of process model that helps organizations improve operational efficiency and process flow.
Spaghetti diagrams use individual lines, or “noodles,” to trace the actual path of each movement through different steps in a process. And because processes involve multiple steps and actions, the end result is a diagram with numerous, jumbled lines—often resembling a plate of spaghetti.
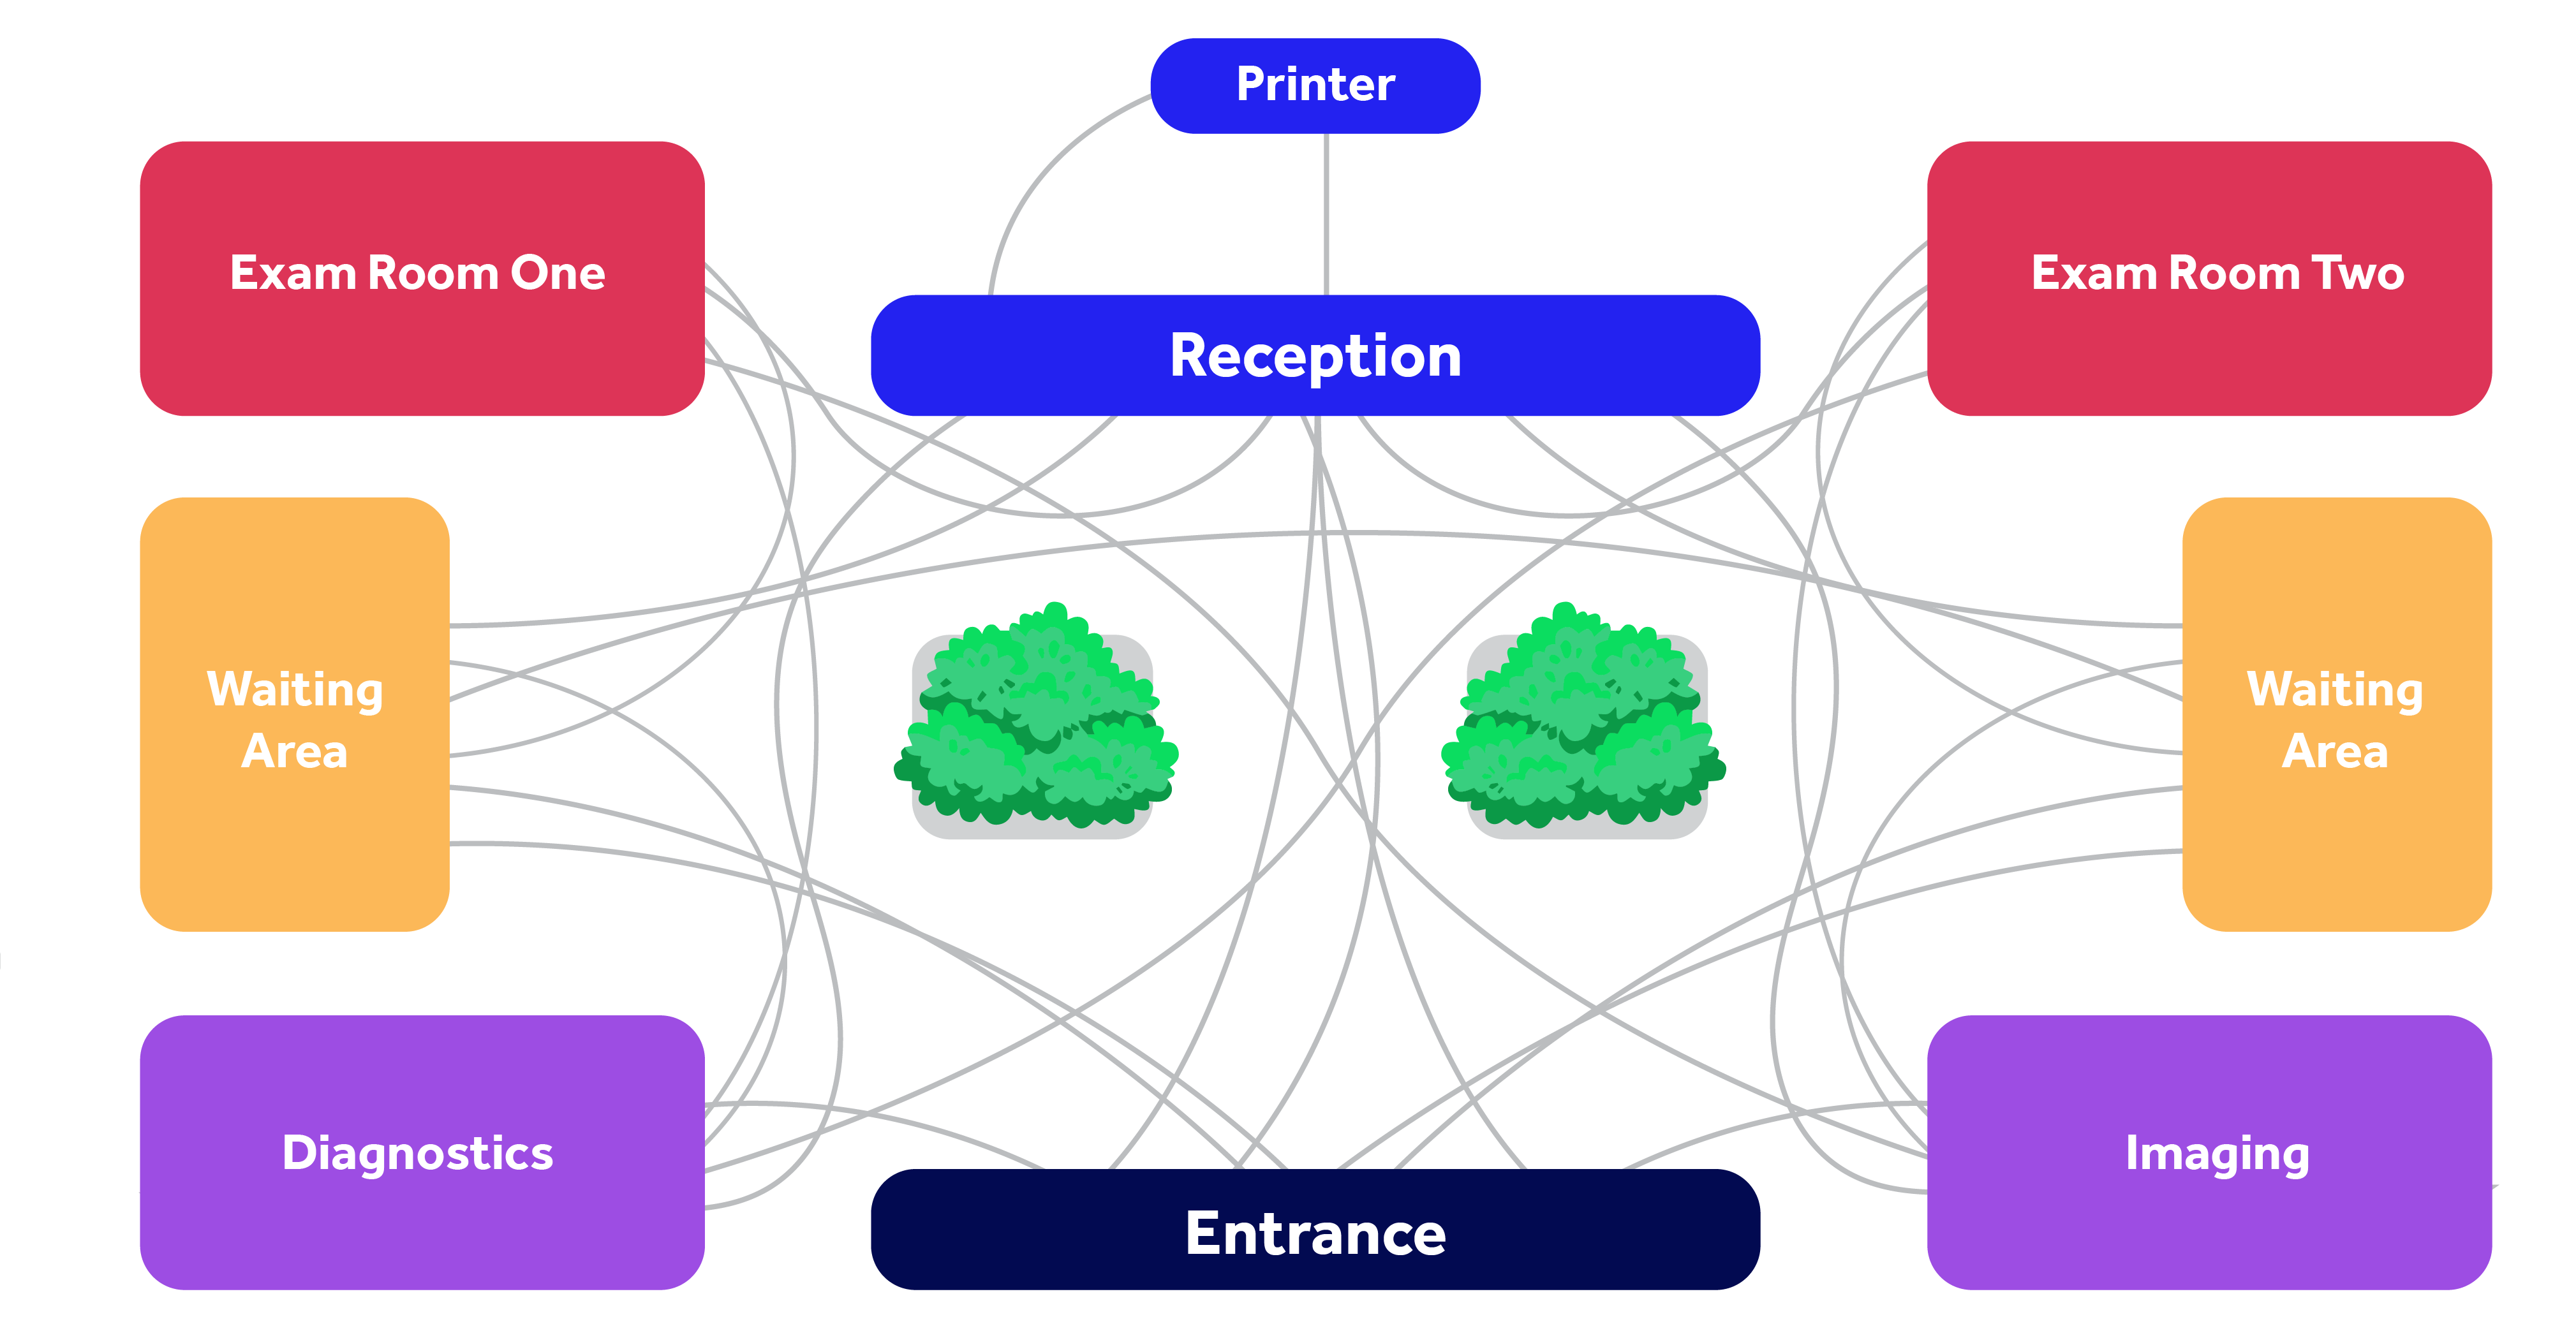
Example of a spaghetti diagram mapping movement in a health care center.
What is a spaghetti diagram used for?
By visualizing how people, data, and objects are moving through a process, spaghetti diagrams make it easier to identify opportunities for improvement. They were developed as a tool for lean methodology and are widely used in manufacturing, logistics, and healthcare, though they can be applied to any industry.
People and product flow.
Spaghetti diagrams are often used to map the movement of workers or products in a physical process. For example, the diagram could be used to visualize the physical flow of workers on a manufacturing floor or how dishes get assembled in a restaurant.
Data and digital process flow.
Spaghetti diagrams can also be used to map the flow of data between systems in digital processes. For example, a financial institution could use a spaghetti diagram to visualize how data moves between systems during customer account creation. Or, an insurance company could use these diagrams to map data flow in an automated underwriting process.
What is a process mining “spaghetti process”?
In process mining, spaghetti processes refer to process models that are dense and complex.
Process mining uses system data to create a visual representation of the steps and interactions involved in a process. This includes the inputs and outputs of each step, the decision points, and the roles of the people involved. The purpose of the resulting model is to provide organizations with a clear understanding of actual process flow that facilitates analysis and improvement.
When a model is complex, it’s said to be “spaghetti-like.” This is often the case for digital processes that have a lot of data moving between multiple systems, like the example below.
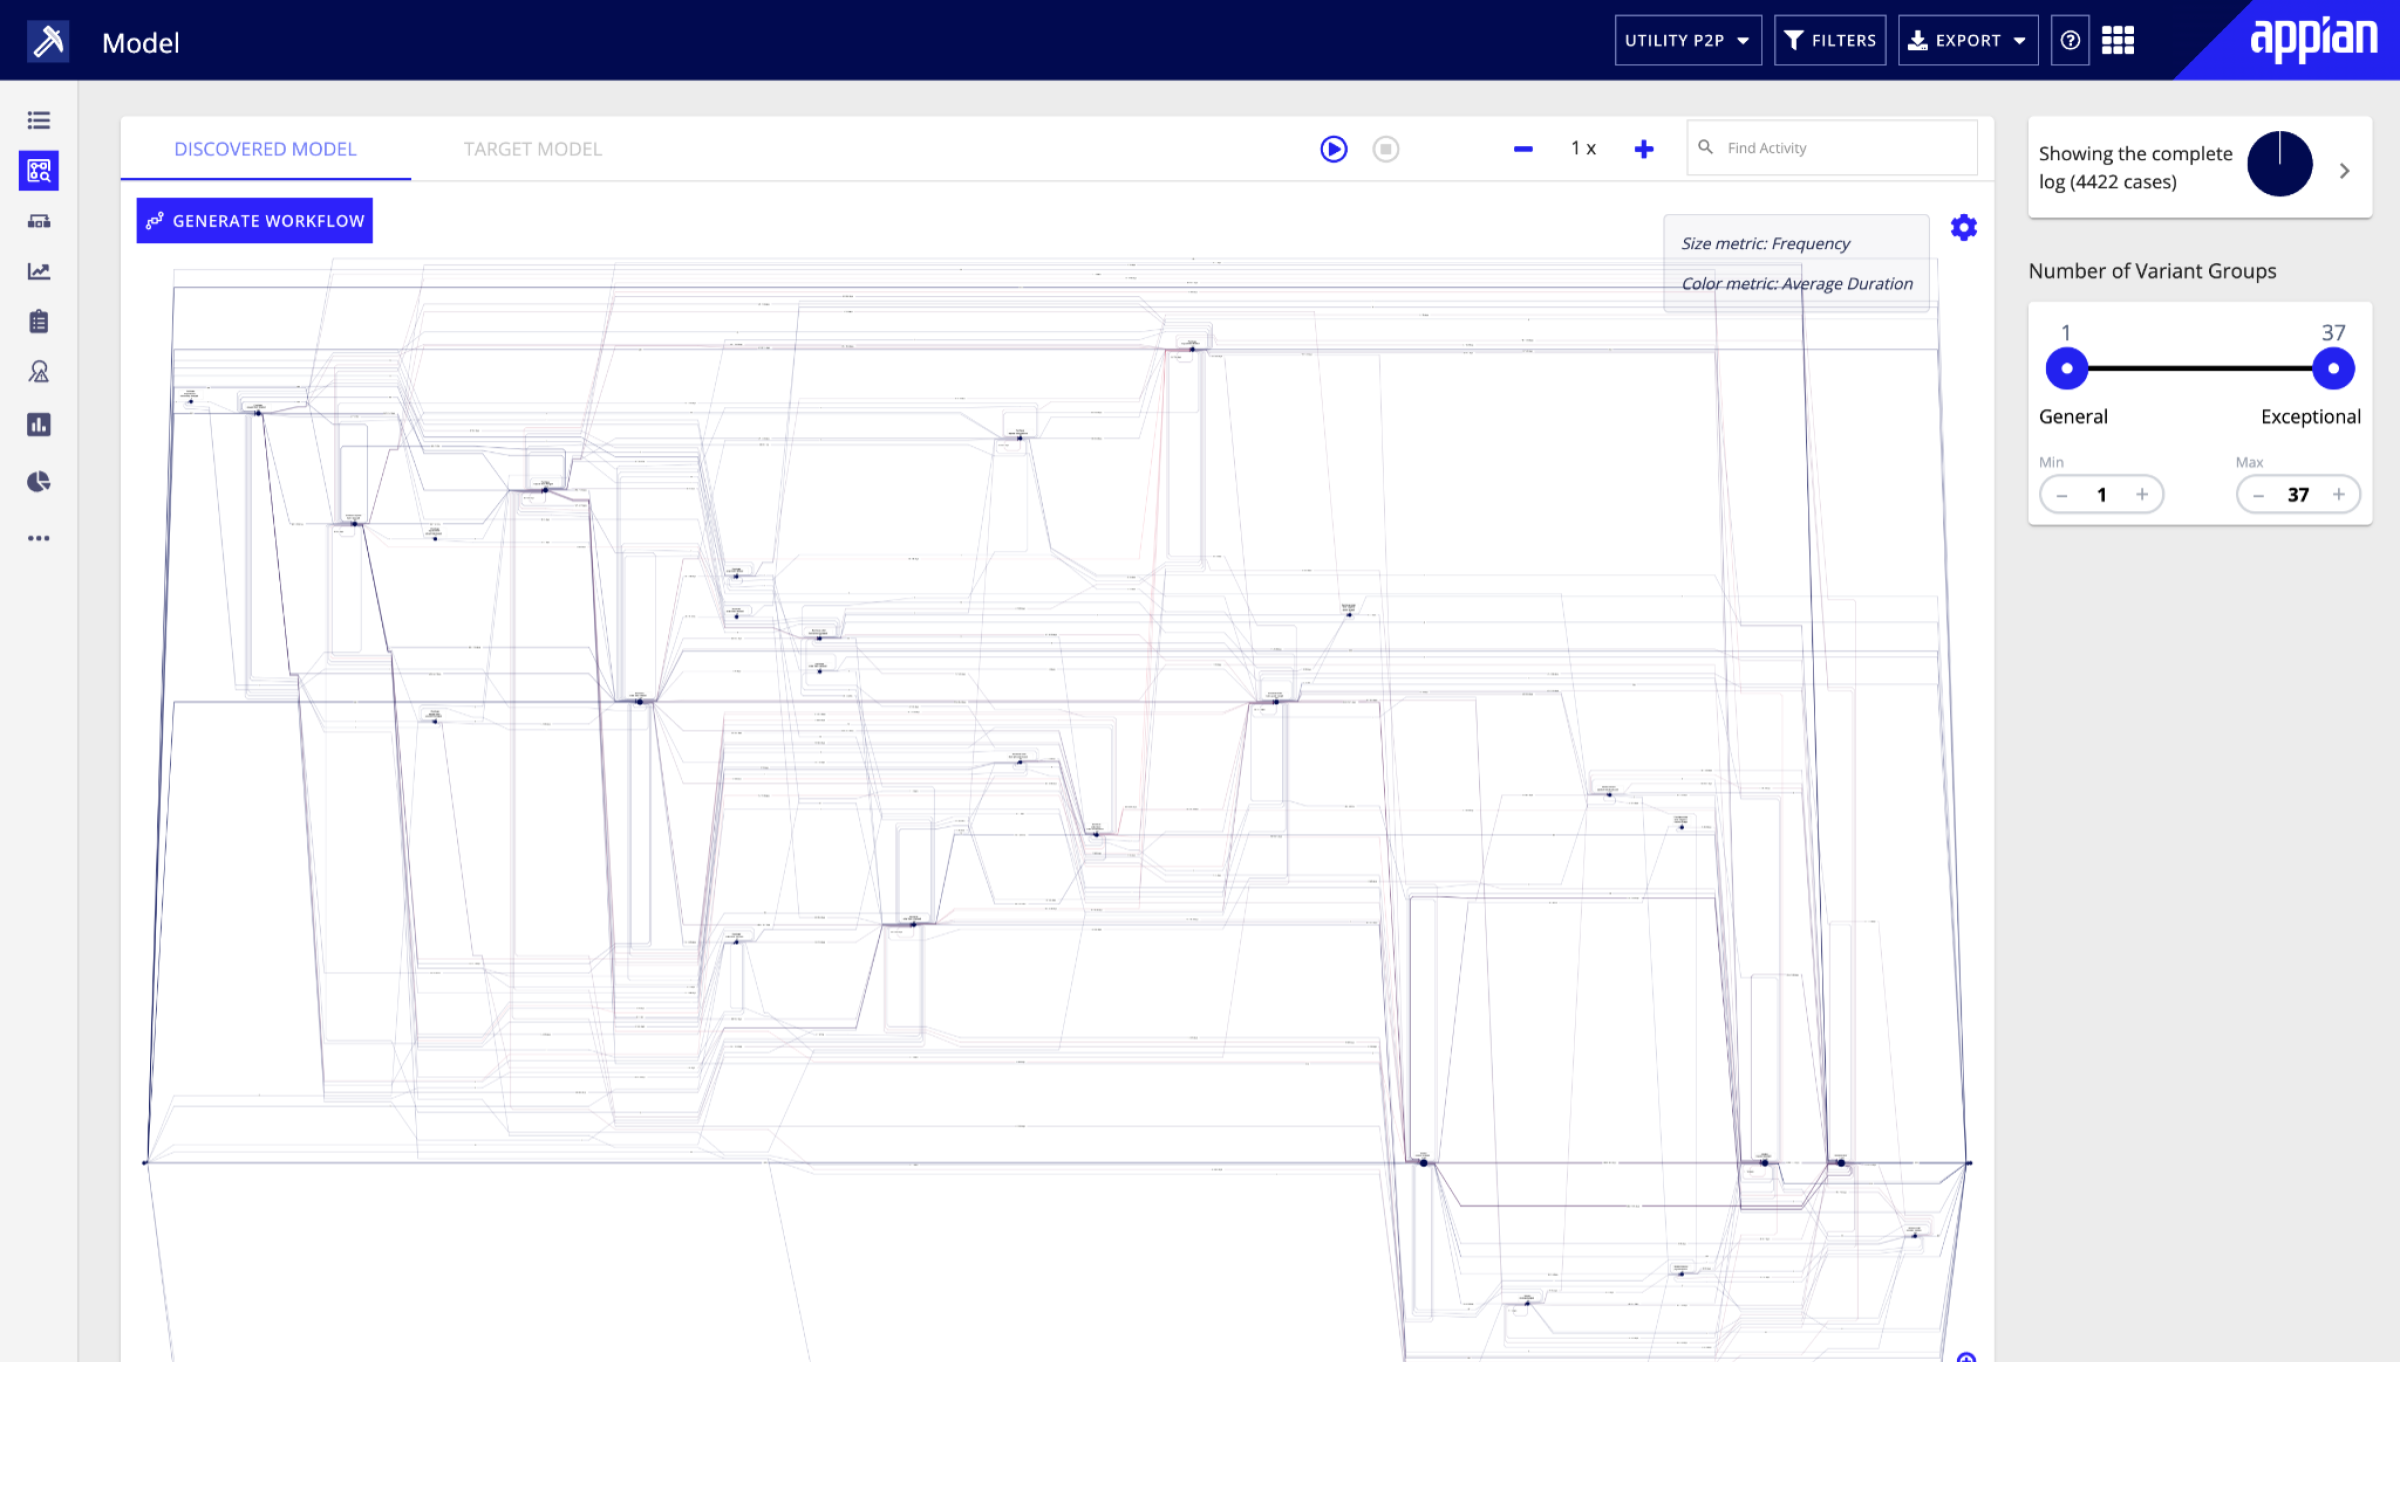
With automated process discovery tools, these models rely on thousands of data points to visually replicate how processes are being carried out—a feat that can’t be done manually.
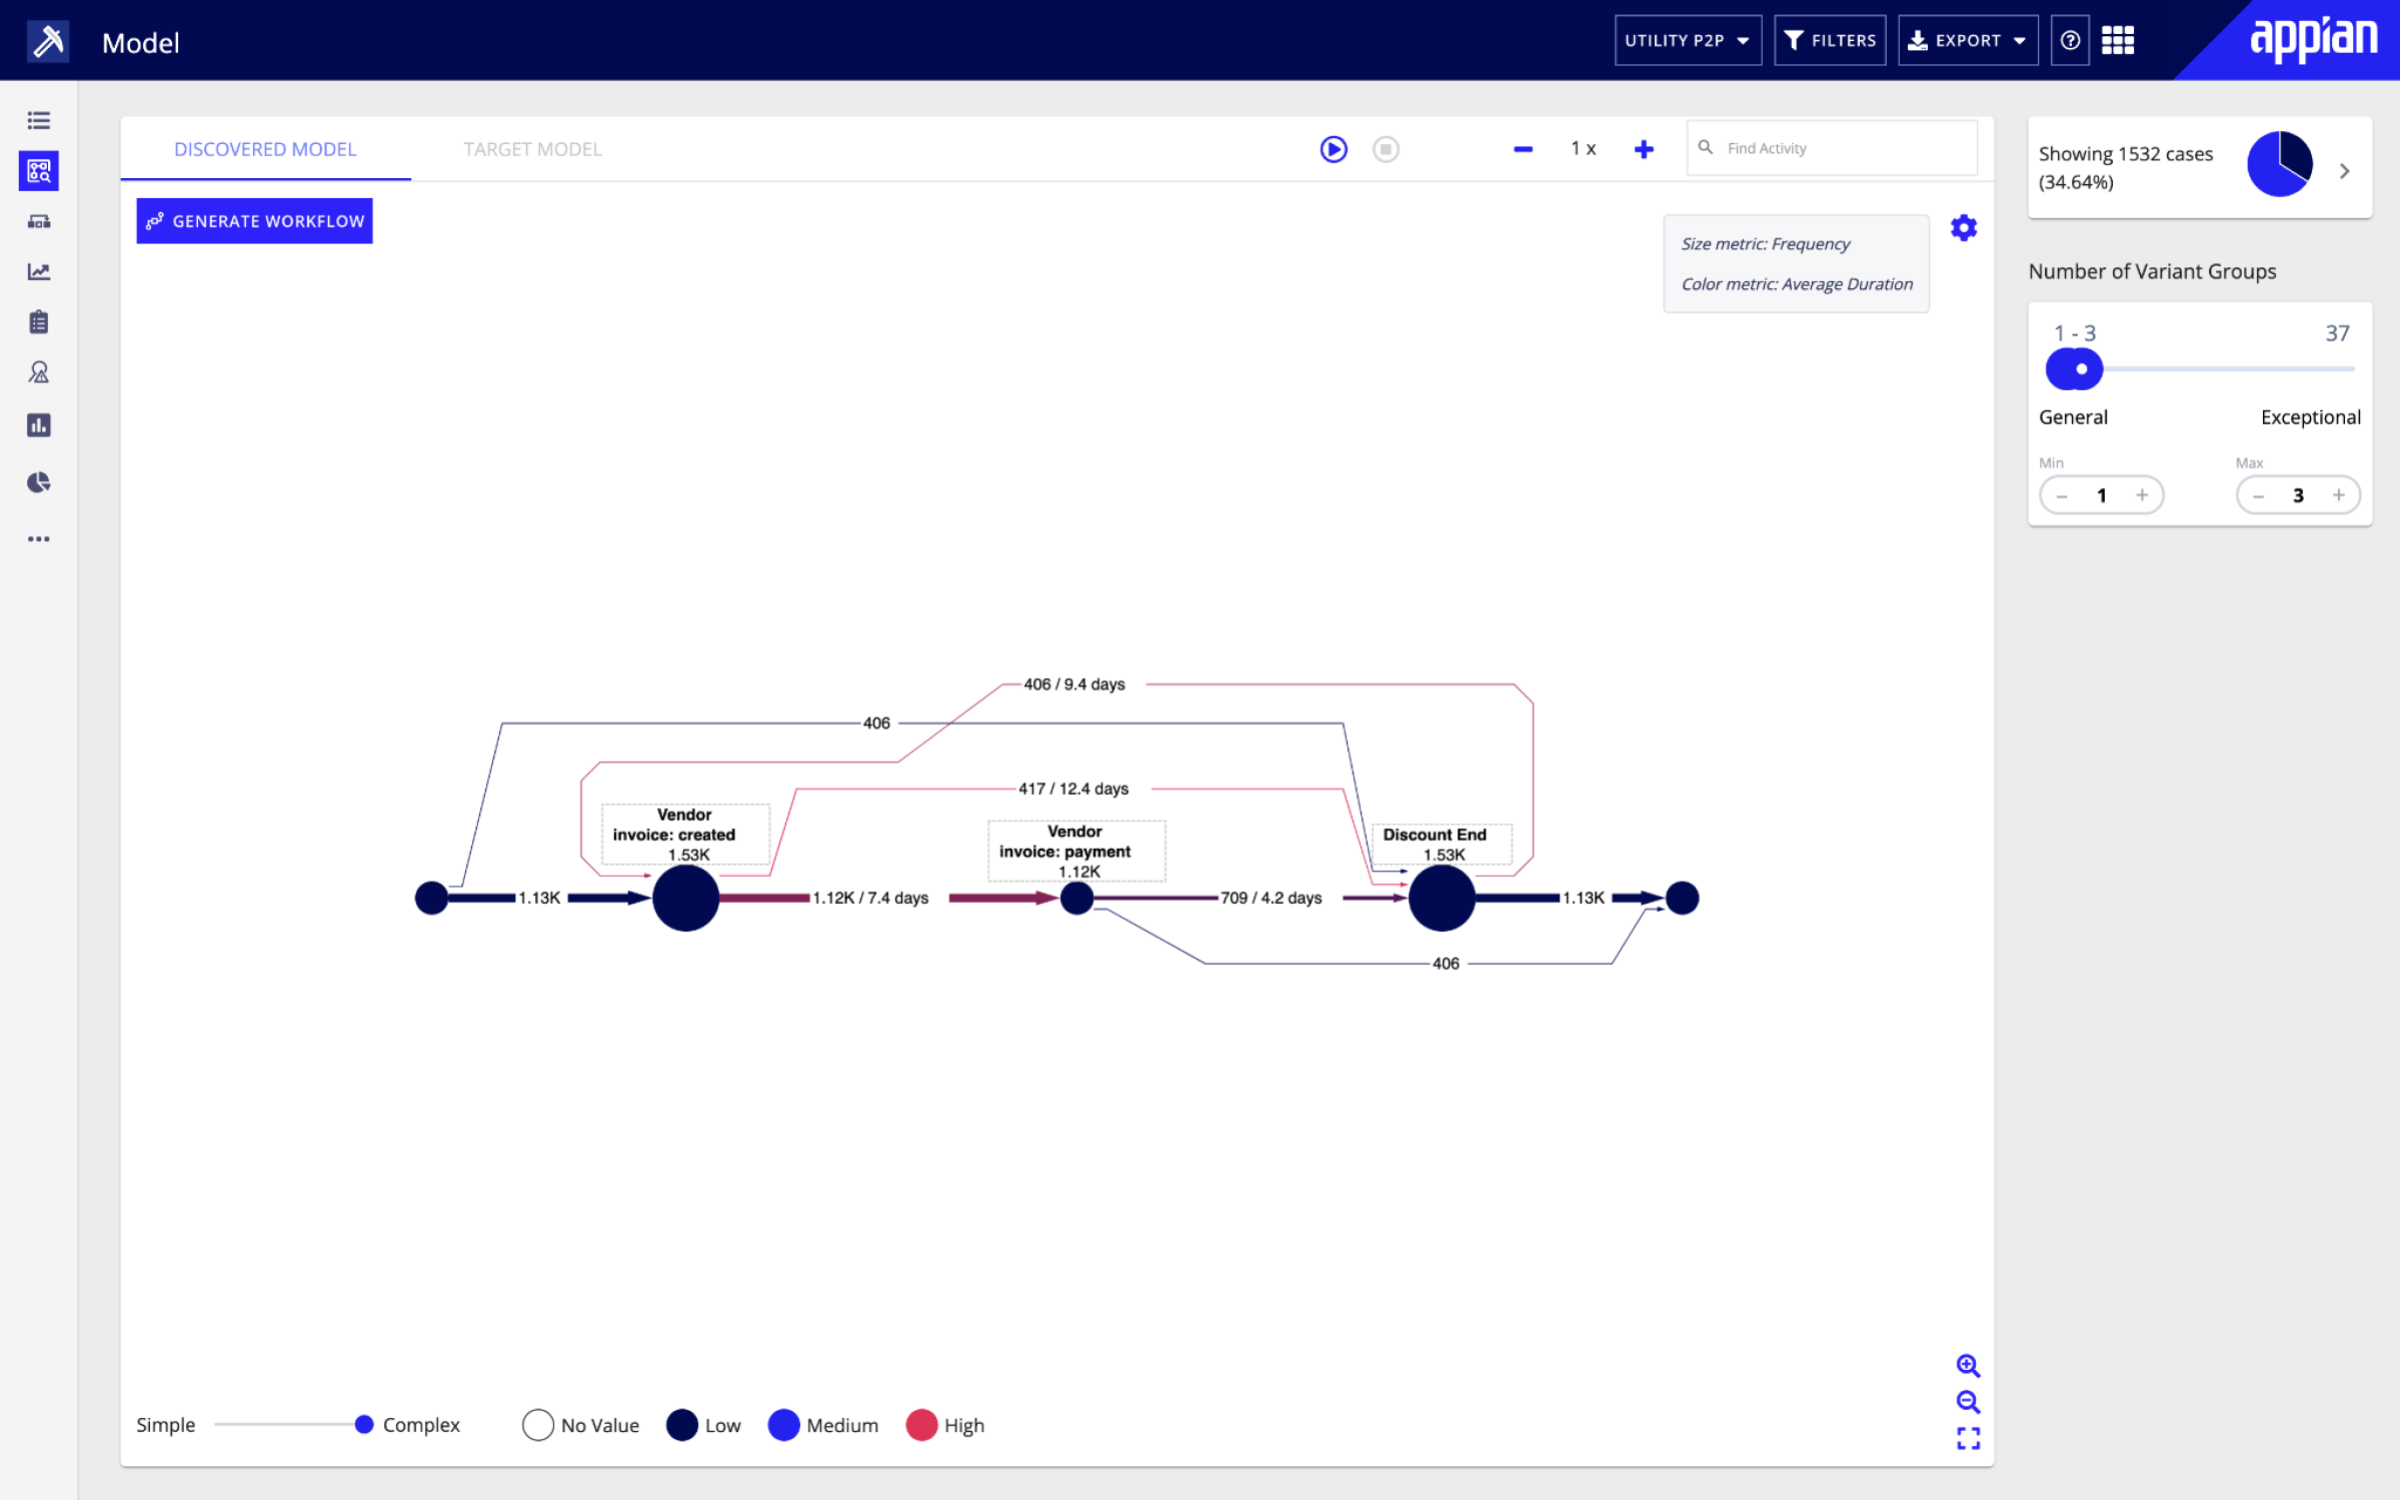
While a spaghetti-like process model can confirm that the process under evaluation is complex and in need of optimization, it doesn’t help you figure out where to start. For this reason, process discovery tools like Appian Process Mining include filtering and conformance checking capabilities. These simplify process visualization by mapping it onto a defined target model and focusing on a subset of activities, cases, or paths, such as in the diagram below. This allows users to quickly identify process variations or areas to improve and uncover the causes of bottlenecks and deviations faster.
Benefits of using a spaghetti diagram.
Spaghetti diagrams are valuable tools for organizations looking to improve their operational efficiency and reduce waste. By providing a visual representation of how people, materials, and data move through processes, these diagrams help business leaders identify areas for improvement, optimize the flow of work, goods, or information, and increase overall productivity.
Process transparency.
A visual representation of your process gives you a clear understanding of how a process actually works versus how you think it works.
Increased collaboration.
Continuous improvement involves everyone in an organization. Spaghetti diagrams provide a common language that helps teams communicate and align on process improvement.
Targeted process improvement.
With your process visualized, you can take a data-driven approach to process improvement that results in faster implementation and better allocation of resources.
Operational efficiency.
Once bottlenecks and inefficiencies are identified, teams can create more efficient processes by optimizing the flow of work, goods, or information using process automation technologies.
Want to drive continuous improvement with process mining? Watch the video to see it in action.