A production plant must be plannable and flexible: It is important to know when a production order will be completed or how quickly a new production order can be started. Possible errors and slowdowns should be easy to identify and to correct, potential improvements should be recognizable. For this purpose, parameters can be defined which provide general information about the plant. An example for the quality of the plannability is the variance of the production time for similar products. An example for plannability and flexibility is the throughput rate. It describes how many workpieces are produced in a plant per time unit (e.g. hour).
Such parameters aggregated on plant level do not allow a direct drilldown, e.g. to potential causes of a greater variance of production times or to sub-processes that slow down the production speed. Process Mining can start at this point, because it allows a drilldown to individual process sections.
Process Mining in Manufacturing
Process Mining is the visualization and analysis of processes on the basis of event logs. In general, event logs are protocols of IT-based processes. During a manufacturing process, data is generated at workstations where workpieces are scanned and processed. If you follow the path of individual workpieces from workstation to workstation, you get their production paths. It is possible to filter for specific sections of the production paths, analyze and understand them individually.
The digital image of the production plant
In production processes with a high degree of standardization, many workpieces have the same production route. Therefore, the most frequent production paths over a longer period of time can be interpreted as a digital image of the production plant. The time period should be at least such that the majority of the production processes described in the data have been completed.
This digital image of the plant learned from the data is not perfect, because there may be missing production routes with rarely used workstations. However, with little effort you can quickly obtain a lot of information about a production plant, information about the majority of the data and useful insights (Pareto principle). Only very little data is needed to create an image of the production plant. It is sufficient to know when which work piece was observed at which workstation.
The throughput rate
If you now look at the frequency of individual events for a selected time period, you get the throughput rate of the workstation described by the event. It describes the “speed” at which workpieces are processed. But Process Mining offers even more information. Since the production route is also learned from the data, changes in throughput rates can be detected.
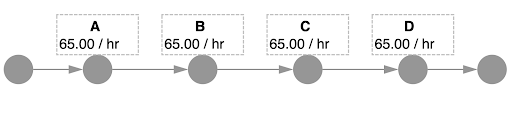
For example, let’s assume a process in which a workpiece has to pass through four workstations A to D. All stations have a target throughput rate of 65 pieces per hour (65/h), shown in the process model below.
Between 3 and 4 hours after the start of work, the rate of finished workpieces drops to 57/h, even though not all planned workpieces have been produced. If one now filters to the time interval of 3 to 4 hours after the start of work, one can immediately see at which point in the production plant the throughput rate fell.
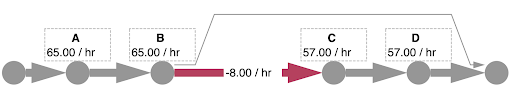
The rate first decreased when machining at or waiting at workstation C. Now it is possible to identify the causes of the problem in a targeted manner and prevent it for future production orders.
With filter settings like these, the soon to be launched Appian AI-Driven Process Mining will give you the possibility to drill down to individual process key figures and sections in a whole new way. The tool thus provides you with an insight into your processes and findings that would not be possible in this form with conventional methods of process analysis.
Learn how process mining can provide valuable insights into your processes.